


Video: A100 80GB vLLM Benchmark for 50 Concurrent Requests

Optimizing vLLM Performance on A100 80GB: Benchmark Insights and Recommendations
When it comes to deploying large language models (LLMs) on high-performance GPUs like the NVIDIA A100 80GB, understanding the nuances of vLLM performance tuning is crucial. Recent benchmarks conducted on Hugging Face models using the vLLM backend reveal critical insights into how different models perform under varying loads. This article delves into the results, offering actionable recommendations for optimizing vLLM server performance, whether you're running benchmarks or considering vLLM server rental options.
Test Overview
1. A100 80GB GPU Details:
- GPU: Nvidia A100 80GB
- Microarchitecture: Ampere
- Compute capability: 8.9
- CUDA Cores: 6912
- Tensor Cores: 432
- Memory: 80GB HBM2e
- FP32 performance: 19.5 TFLOPS
2. Test Project Code Source:
- We used this git project to build the environment(https://github.com/vllm-project/vllm)
3. The Following Models from Hugging Face were Tested:
- google/gemma-2-9b-it
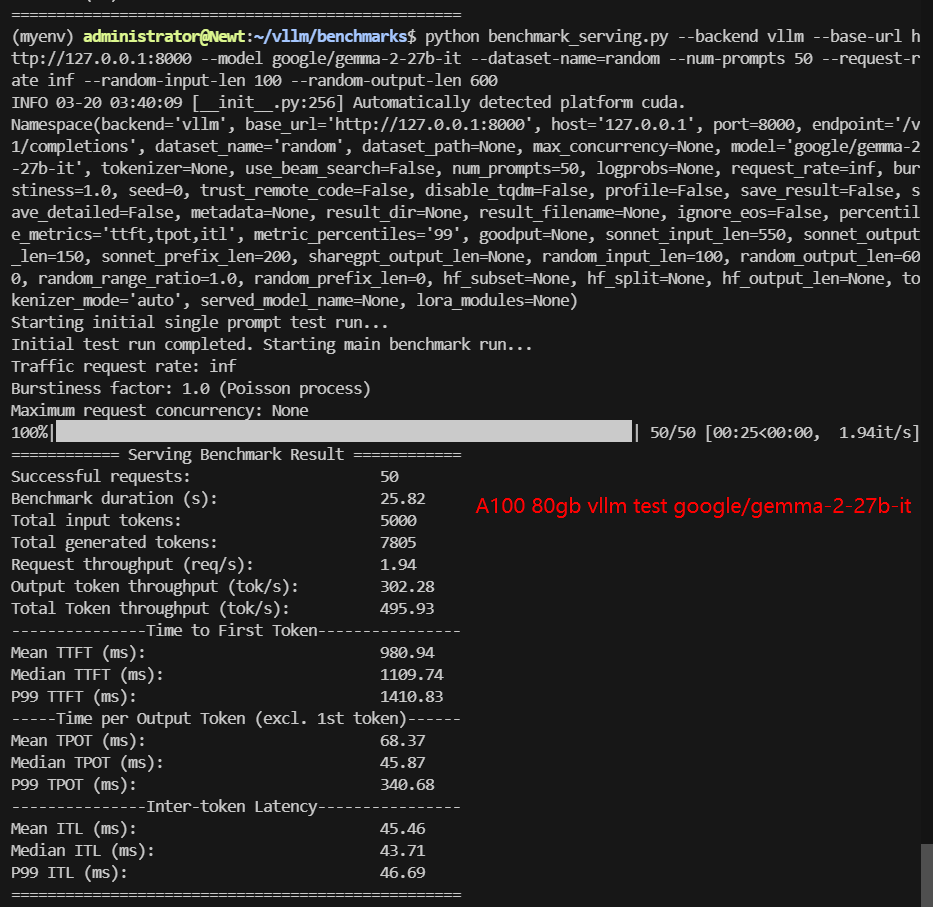
- google/gemma-2-27b-it
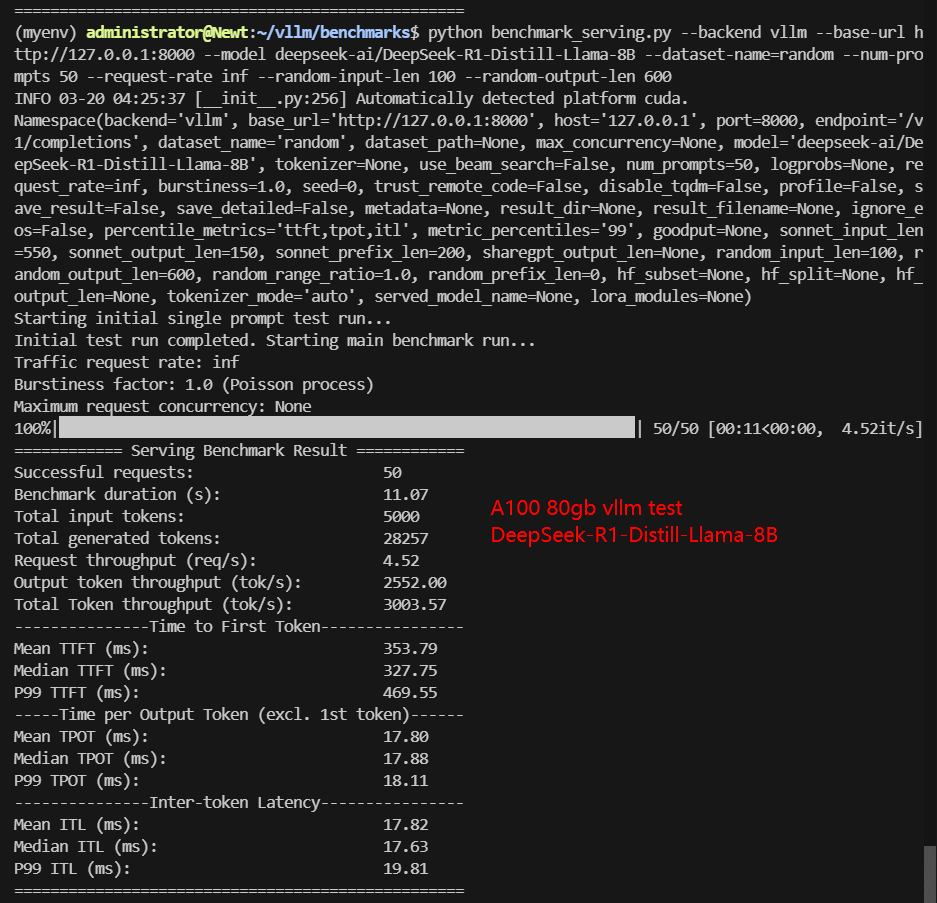
- deepseek-ai/DeepSeek-R1-Distill-Llama-8B
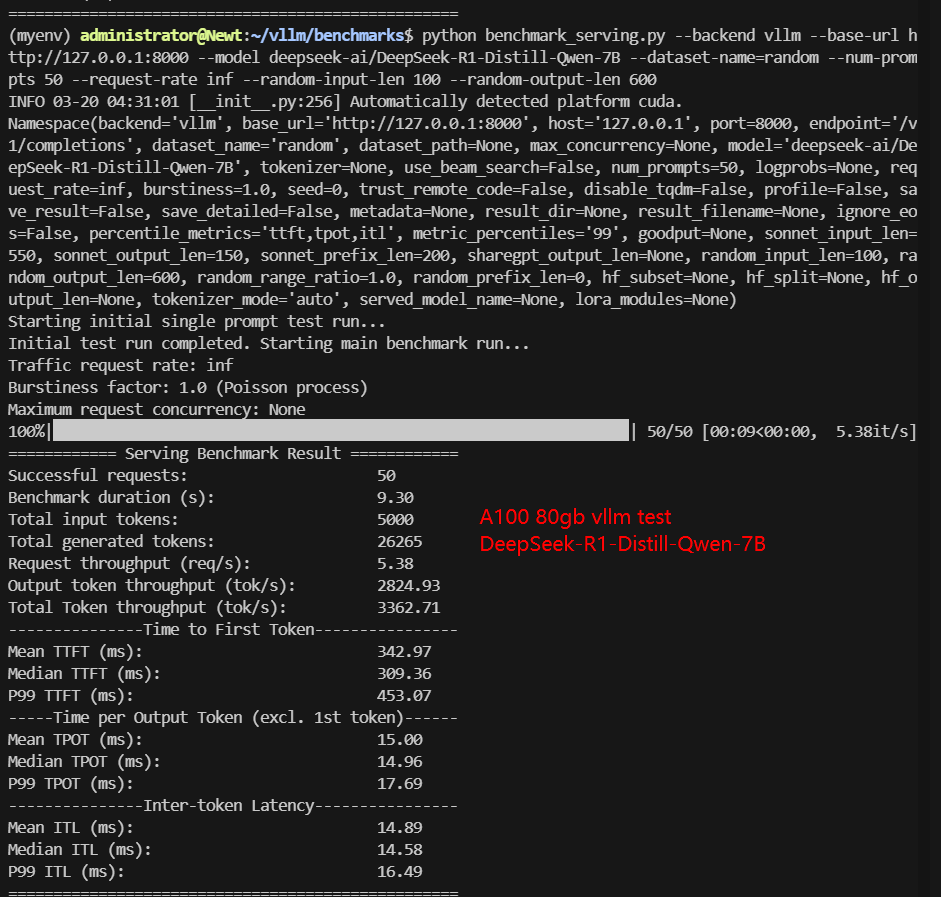
- deepseek-ai/DeepSeek-R1-Distill-Qwen-7B
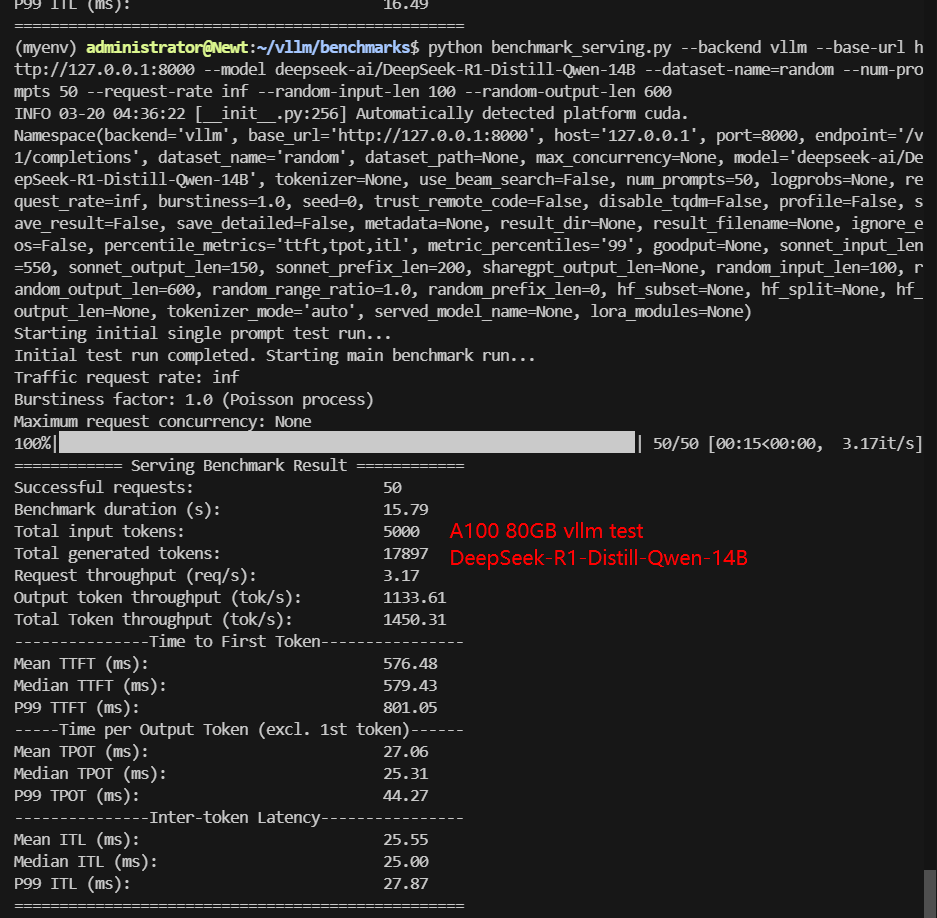
- deepseek-ai/DeepSeek-R1-Distill-Qwen-14B
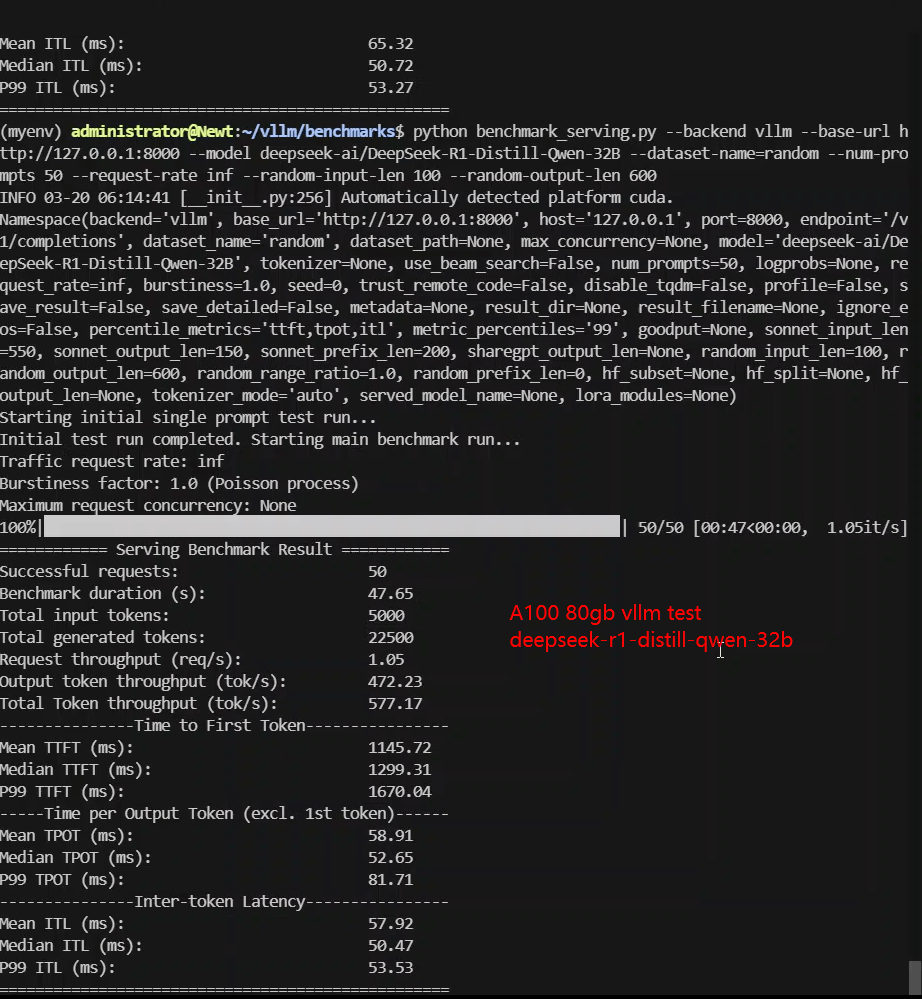
- deepseek-ai/DeepSeek-R1-Distill-Qwen-32B
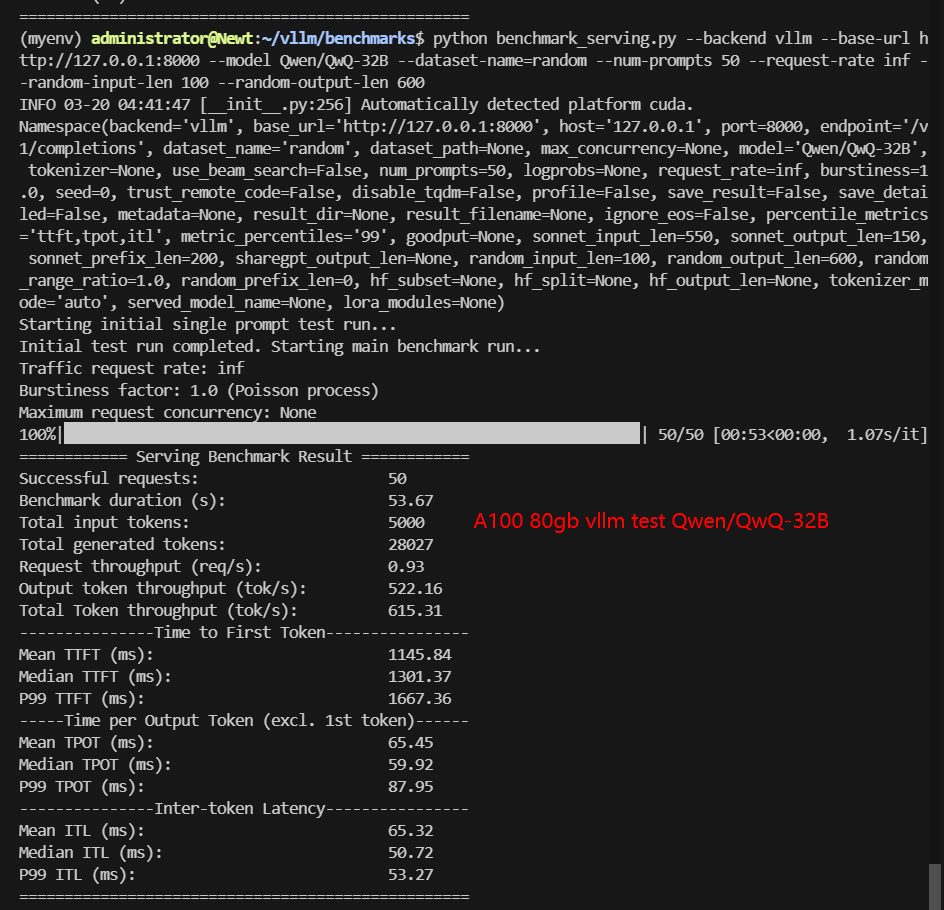
- Qwen/QwQ-32B
4. The Online Test Parameters are Preset as Follows:
- Simulate real client requests, suitable for evaluating the performance of the system in an actual production environment.
- Input length: 100 tokens
- Output length: 600 tokens
- Request Numbers: 50
A100 Benchmark for Scenario 1: 50 Concurrent Requests
| Models | gemma-2-9b-it | gemma-2-27b-it | DeepSeek-R1-Distill-Llama-8B | DeepSeek-R1-Distill-Qwen-7B | DeepSeek-R1-Distill-Qwen-14B | DeepSeek-R1-Distill-Qwen-32B | QwQ-32B |
|---|---|---|---|---|---|---|---|
| Quantization | 16 | 16 | 16 | 16 | 16 | 16 | 16 |
| Size(GB) | 18GB | 51GB | 15GB | 15GB | 28GB | 62GB | 62GB |
| Backend/Platform | vLLM | vLLM | vLLM | vLLM | vLLM | vLLM | vLLM |
| Successful Requests | 50 | 50 | 50 | 50 | 50 | 50 | 50 |
| Benchmark Duration(s) | 3.25 | 25.82 | 11.07 | 9.30 | 15.79 | 47.65 | 53.67 |
| Total Input Tokens | 5000 | 5000 | 5000 | 5000 | 5000 | 5000 | 5000 |
| Total Generated Tokens | 1066 | 7805 | 28257 | 26265 | 17897 | 22500 | 28027 |
| Request (req/s) | 15.40 | 1.94 | 4.52 | 5.38 | 3.17 | 1.05 | 0.93 |
| Input (tokens/s) | 1540.09 | 193.65 | 451.57 | 537.78 | 316.7 | 104.94 | 93.15 |
| Output (tokens/s) | 328.35 | 302.28 | 2552.00 | 2824.93 | 1133.61 | 472.23 | 522.16 |
| Total Throughput (tokens/s) | 1868.44 | 495.93 | 3003.57 | 3362.71 | 1450.31 | 577.17 | 615.31 |
| Time to First Token(TTFT)(ms) | 405.48 | 1109.74 | 327.75 | 309.36 | 579.43 | 1299.31 | 1301.37 |
| Time per Output Token(TPOT)(ms) | 71.98 | 45.87 | 17.88 | 14.96 | 25.31 | 52.65 | 59.92 |
| Per User Eval Rate(tokens/s) | 13.91 | 21.80 | 55.92 | 66.84 | 39.51 | 18.99 | 16.69 |
✅ Key Takeaways of Scenario 1: 50 Concurrent Requests
- DeepSeek-R1 Distill-Qwen-7B achieved the highest throughput at 3362.71 tokens/s.
- DeepSeek-R1 Distill-Qwen-14B followed with 3003.57 tokens/s.
- DeepSeek-R1 Distill-Qwen-32B had significantly lower throughput at 577.17 tokens/s, indicating scalability issues on A100 80GB.
- Google Gemma 2-9B had the best request rate at 15.40 requests/s.
- Time to First Token (TTFT) increased significantly for larger models, with DeepSeek-R1 Distill-Qwen-32B reaching 1301.37ms, leading to higher latency.
A100 Benchmark for Scenario 2: 300 Concurrent Requests
We try to increase the number of requests to 300 requests to see how the A100 GPU can handle it.
| Models | gemma-2-9b-it | gemma-2-27b-it | DeepSeek-R1-Distill-Llama-8B | DeepSeek-R1-Distill-Qwen-7B | DeepSeek-R1-Distill-Qwen-14B | DeepSeek-R1-Distill-Qwen-32B | QwQ-32B |
|---|---|---|---|---|---|---|---|
| Quantization | 16 | 16 | 16 | 16 | 16 | 16 | 16 |
| Size(GB) | 18GB | 51GB | 15GB | 15GB | 28GB | 62GB | 62GB |
| Backend/Platform | vLLM | vLLM | vLLM | vLLM | vLLM | vLLM | vLLM |
| Successful Requests | 300 | 300 | 300 | 300 | 300 | 300 | 300 |
| Benchmark Duration(s) | 13.72 | 50.47 | 28.55 | 24.26 | 35.18 | 230.45 | 291.19 |
| Total Input Tokens | 30000 | 30000 | 30000 | 30000 | 30000 | 30000 | 30000 |
| Total Generated Tokens | 7031 | 46159 | 165353 | 164823 | 117309 | 136100 | 174562 |
| Request (req/s) | 21.86 | 5.94 | 10.51 | 12.37 | 8.53 | 1.3 | 1.03 |
| Input (tokens/s) | 2185.93 | 594.46 | 1050.65 | 1236.61 | 852.76 | 130.18 | 103.02 |
| Output (tokens/s) | 512.31 | 914.67 | 5790.92 | 6794.01 | 3334.57 | 590.57 | 599.49 |
| Total Throughput (tokens/s) | 2698.24 | 1509.13 | 6841.57 | 8030.62 | 4187.33 | 720.75 | 702.51 |
| Time to First Token(TTFT)(ms) | 1739.09 | 4307.48 | 1655.11 | 1538.09 | 2565.28 | 66999.66 | 94024.66 |
| Time per Output Token(TPOT)(ms) | 176.85 | 109.99 | 44.51 | 37.78 | 55.64 | 82.41 | 96.36 |
| Per User Eval Rate(tokens/s) | 5.65 | 9.09 | 22.47 | 26.47 | 17.97 | 12.13 | 10.38 |
✅ Key Takeaways of Scenario 2: 300 Concurrent Requests
- When handling 300 simultaneous requests, 32B models faced severe latency issues. TTFT for Qwen/QwQ-32B surged to 94024.66ms, making it impractical for real-time applications. DeepSeek-R1 Distill-Qwen-32B also struggled, with TTFT reaching 66999.66ms.
- Google Gemma 2-9B maintained a reasonable TTFT (176.85ms) but had low output rate.
- 7B-14B and smaller models (DeepSeek-R1, Qwen, Llama) performed best, balancing throughput and latency.
Key Insights: Best Models for vLLM on A100 80GB
1. Impact of Request Volume on Performance:
The benchmark tests were conducted with two primary configurations:
- 50 requests: Input length of 100 tokens, output length of 600 tokens.
- 300 requests: Same input and output lengths but with a significantly higher request volume.
The results highlight a stark contrast in performance, especially for larger models like the 32B variants. For instance, the Time to First Token (TTFT) for the 32B models skyrocketed to 66,999.66 ms and 94,024.66 ms under 300 requests. This indicates that while the A100 80GB can handle 32B models with 50 requests, scaling to 300 requests leads to unacceptable user wait times. For high-traffic scenarios, it's advisable to opt for smaller models like Llama, Qwen, or DeepSeek-R1 in the 14B and below range, which demonstrated more stable performance.
2. Model-Specific Performance Insights
- Gemma Models: The Gemma-2-9b-it and Gemma-2-27b-it models showed lower output token rates, suggesting they prioritize concise responses rather than facing performance bottlenecks. These models are ideal for applications requiring brief, to-the-point answers.
- DeepSeek-R1-Distill-Qwen-7B: This model stood out with the highest Total Throughput (tokens/s) at 3362.71 tokens/s and the lowest Time per Output Token (TPOT) at 14.96 ms. Its efficiency makes it a top choice for applications demanding high throughput and low latency.
- Qwen and DeepSeek-R1 Models: These models, particularly in the 14B and below configurations, consistently delivered strong performance across all metrics, making them reliable choices for various deployment scenarios.
3. Hardware Considerations: A100 80GB vs. H100 80GB
While the A100 80GB is a powerful GPU, it pales in comparison to the H100 80GB in terms of raw performance. For organizations with higher computational demands or those aiming for future-proof infrastructure, investing in H100 GPUs is recommended. The H100's superior architecture and performance capabilities make it better suited for handling larger models and higher request volumes without compromising on latency or throughput.
Recommendations for vLLM Performance Tuning
✅ Optimize Request Volume
Avoid overloading the server with excessive requests, especially when using larger models. For 32B models, limit the number of concurrent requests to 50 to maintain acceptable TTFT and TPOT values.
✅ Choose the Right Model
For high-traffic environments, prioritize smaller models like Llama, Qwen, or DeepSeek-R1 in the 14B and below range. These models offer a balanced trade-off between performance and resource utilization.
✅ Consider Hardware Upgrades
If your workload demands higher performance, consider upgrading to H100 80GB GPUs. The enhanced capabilities of the H100 will provide better scalability and efficiency, particularly for larger models and higher request volumes.
✅ Leverage vLLM Server Rental Services
For organizations looking to avoid the upfront costs of high-end GPUs, vLLM server rental services offer a flexible and cost-effective solution. These services provide access to optimized infrastructure, ensuring high performance without the need for significant capital investment.
✅ Monitor and Adjust
Continuously monitor performance metrics such as TTFT, TPOT, and throughput. Use these insights to fine-tune your deployment, adjusting request rates and model sizes as needed to maintain optimal performance.
Get Started with A100 Server Hosting
Interested in optimizing your LLM deployment? Check out GPU server rental services or explore alternative GPUs for high-end AI inference.
Enterprise GPU Dedicated Server - H100
$ 2099.00/mo
1mo3mo12mo24mo
Order Now- 256GB RAM
- Dual 18-Core E5-2697v4
- 240GB SSD + 2TB NVMe + 8TB SATA
- 100Mbps-1Gbps
- OS: Windows / Linux
- GPU: Nvidia H100
- Microarchitecture: Hopper
- CUDA Cores: 14,592
- Tensor Cores: 456
- GPU Memory: 80GB HBM2e
- FP32 Performance: 183TFLOPS
New Arrival
Enterprise GPU Dedicated Server - A100(80GB)
$ 1559.00/mo
1mo3mo12mo24mo
Order Now- 256GB RAM
- Dual 18-Core E5-2697v4
- 240GB SSD + 2TB NVMe + 8TB SATA
- 100Mbps-1Gbps
- OS: Windows / Linux
- GPU: Nvidia A100
- Microarchitecture: Ampere
- CUDA Cores: 6912
- Tensor Cores: 432
- GPU Memory: 80GB HBM2e
- FP32 Performance: 19.5 TFLOPS
Multi-GPU Dedicated Server - 2xA100
$ 1099.00/mo
1mo3mo12mo24mo
Order Now- 256GB RAM
- Dual 18-Core E5-2697v4
- 240GB SSD + 2TB NVMe + 8TB SATA
- 1Gbps
- OS: Windows / Linux
- GPU: Nvidia A100
- Microarchitecture: Ampere
- CUDA Cores: 6912
- Tensor Cores: 432
- GPU Memory: 40GB HBM2
- FP32 Performance: 19.5 TFLOPS
- Free NVLink Included
- A Powerful Dual-GPU Solution for Demanding AI Workloads, Large-Scale Inference, ML Training.etc. A cost-effective alternative to A100 80GB and H100, delivering exceptional performance at a competitive price.
Flash Sale to April 30
Enterprise GPU Dedicated Server - A100
$ 469.00/mo
41% OFF Recurring (Was $799.00)
1mo3mo12mo24mo
Order Now- 256GB RAM
- Dual 18-Core E5-2697v4
- 240GB SSD + 2TB NVMe + 8TB SATA
- 100Mbps-1Gbps
- OS: Windows / Linux
- GPU: Nvidia A100
- Microarchitecture: Ampere
- CUDA Cores: 6912
- Tensor Cores: 432
- GPU Memory: 40GB HBM2
- FP32 Performance: 19.5 TFLOPS
- Good alternativeto A800, H100, H800, L40. Support FP64 precision computation, large-scale inference/AI training/ML.etc
Conclusion: A100 is the Best Choice for 7-14B LLMs on Hugging Face
The A100 80GB is capable of efficient LLM inference but has limitations with large-scale deployments of 32B models. If you're looking for vLLM Performance Tuning, A100 80GB test results, or optimizing Hugging Face LLM inference, models like DeepSeek-R1 Distill-Qwen-7B and 14B offer the best balance of performance and response time.
For high-performance LLM inference at scale, consider H100 GPUs or optimizing model quantization to improve throughput.
The A100 80GB vLLM benchmark results underscore the importance of strategic model selection and performance tuning when deploying LLMs. By understanding the strengths and limitations of different models and hardware configurations, organizations can optimize their vLLM deployments for maximum efficiency and user satisfaction. Whether you're running benchmarks, considering a vLLM server rental, or planning a hardware upgrade, these insights will help you make informed decisions to meet your performance goals.
For more detailed benchmarks and performance tuning tips, stay tuned to our blog and explore our comprehensive guides on vLLM performance tuning, A100 80GB test results, and Hugging Face LLM deployments.
Attachment: Video Recording of A100 80GB vLLM Benchmark
Video: A100 80GB vLLM Benchmark for 300 Concurrent Requests
Screenshot: A100 80GB GPU vLLM Benchmark for 50 Request

Data Item Explanation in the Table:
- Quantization: The number of quantization bits. This test uses 16 bits, a full-blooded model.
- Size(GB): Model size in GB.
- Backend: The inference backend used. In this test, vLLM is used.
- Successful Requests: The number of requests processed.
- Benchmark duration(s): The total time to complete all requests.
- Total input tokens: The total number of input tokens across all requests.
- Total generated tokens: The total number of output tokens generated across all requests.
- Request (req/s): The number of requests processed per second.
- Input (tokens/s): The number of input tokens processed per second.
- Output (tokens/s): The number of output tokens generated per second.
- Total Throughput (tokens/s): The total number of tokens processed per second (input + output).
- Time to First Token(TTFT)(ms): The time from when the request is made to when the first token is received, in milliseconds. A lower TTFT means that the user is able to get a response faster.
- Time per Output Token(TPOT)(ms): The time required to generate each output token, in milliseconds. A lower TPOT indicates that the system is able to generate a complete response faster.
- Per User Eval Rate(tokens/s): The number of tokens evaluated per second per user. A high evaluation rate indicates that the system is able to serve each user efficiently.
Tags:
vLLM Performance Tuning, A100 80GB test, LLM A100 80GB, Hugging Face LLM, vLLM benchmark, vLLM server rental, LLM inference, A100 GPU benchmark, deepseek r1 performance, LLM throughput, AI model inference, vLLM token generation, AI latency test, cloud GPU rental