


2*RTX 4090 vLLM Benchmark: 50 Concurrent Requests Test Hugging Face LLMs

2*RTX 4090 vLLM Benchmark: Dual GPU Parallel Inference for Hugging Face LLM
With the growing adoption of large language models (LLMs), selecting the best GPU for 14B-16B(~30GB) model inference is a critical decision for AI developers and cloud providers. This article presents a vLLM benchmark on 2*RTX 4090, evaluating dual GPU parallel inference Hugging Face LLMs with vLLM performance tuning.
If you are looking for GPU recommendations for 14B-16B models, interested in vLLM 2*RTX4090 performance, or considering vLLM server rental, this benchmark will provide key insights.
Test Overview
1. A RTX4090 GPU Details(No NVLink):
- GPU: NVIDIA RTX 4090
- Microarchitecture: Ada Lovelace
- Compute capability: 8.9
- CUDA Cores: 16384
- Tensor Cores: 512
- Memory: 24GB GDDR6X
- FP32 performance: 82.6 TFLOPS
2. Test Project Code Source:
- We used this git project to build the environment(https://github.com/vllm-project/vllm)
3. The Following Models from Hugging Face were Tested:
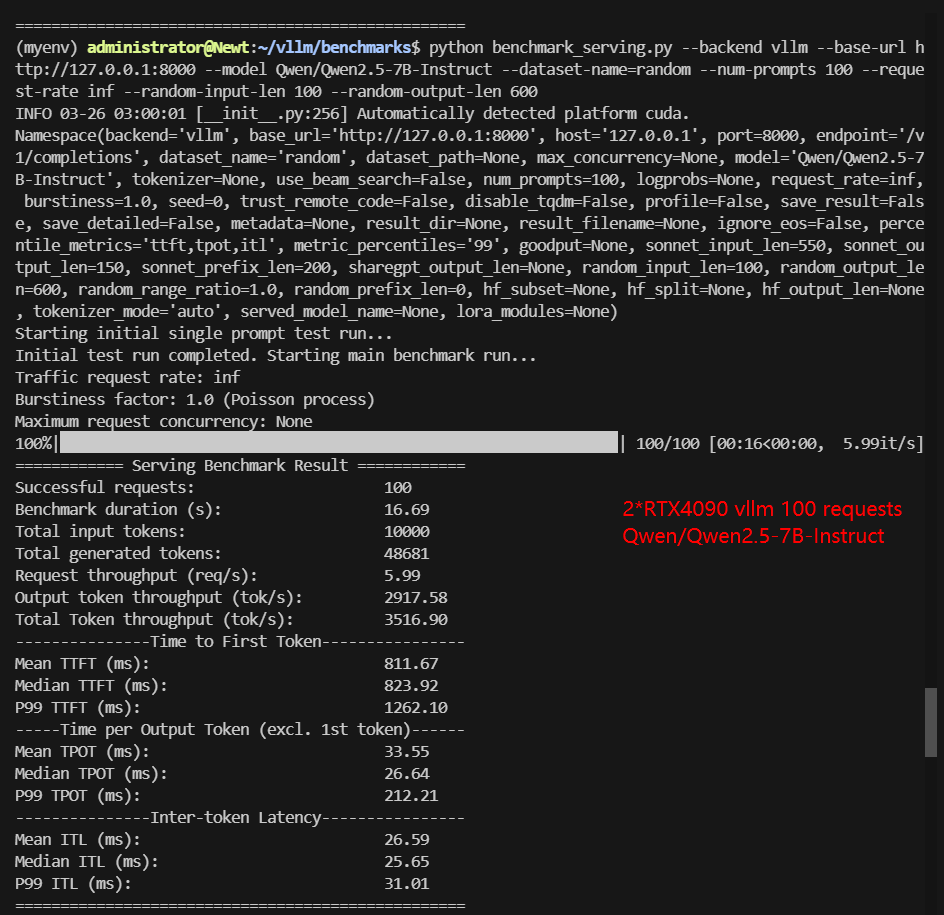
- Qwen/Qwen2.5-7B-Instruct
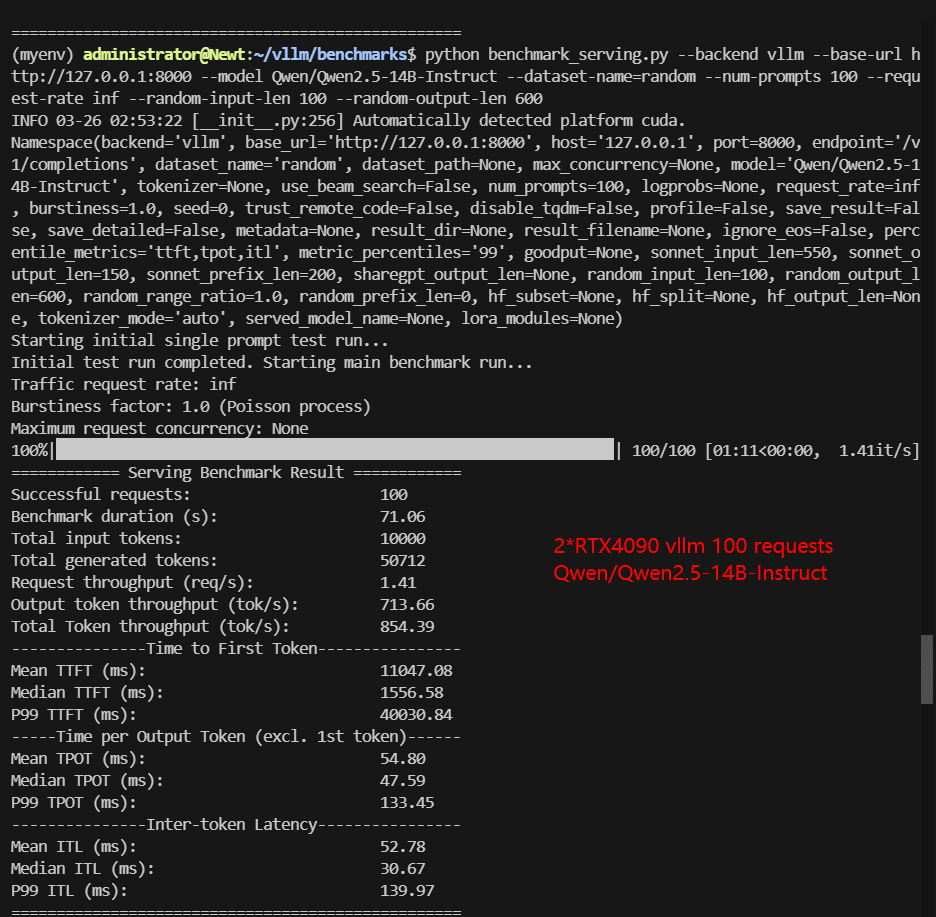
- Qwen/Qwen2.5-14B-Instruct
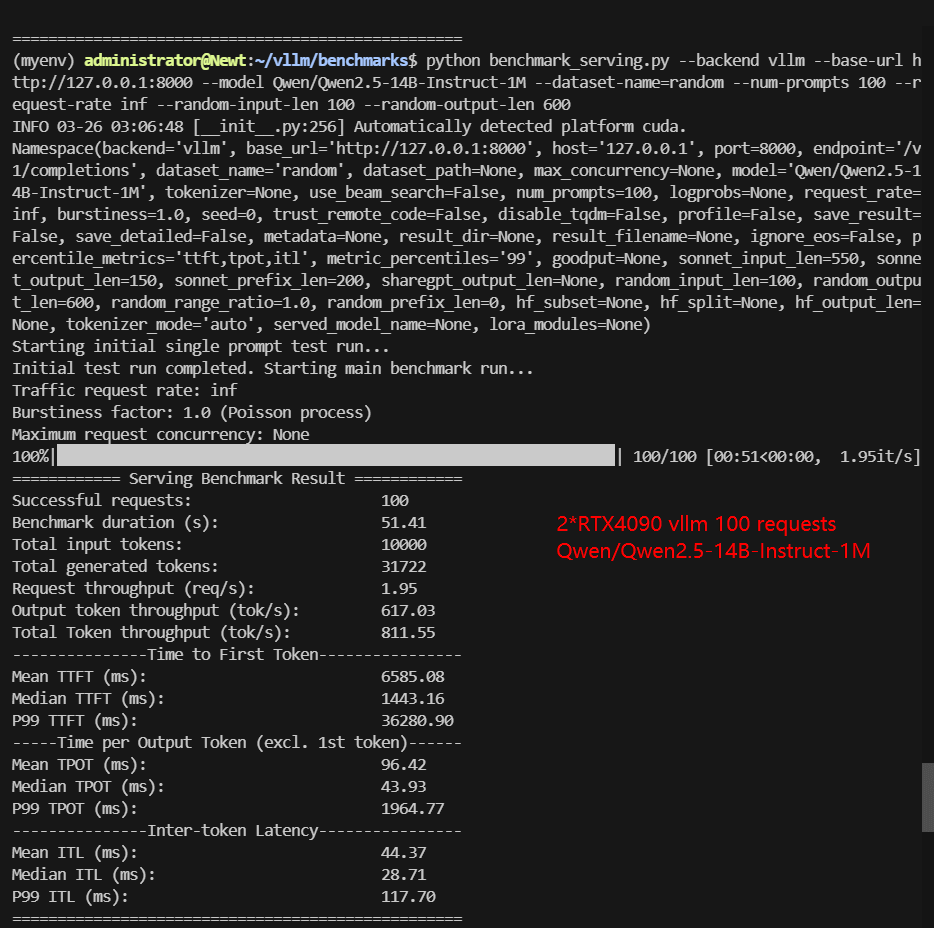
- Qwen/Qwen2.5-14B-Instruct-1M
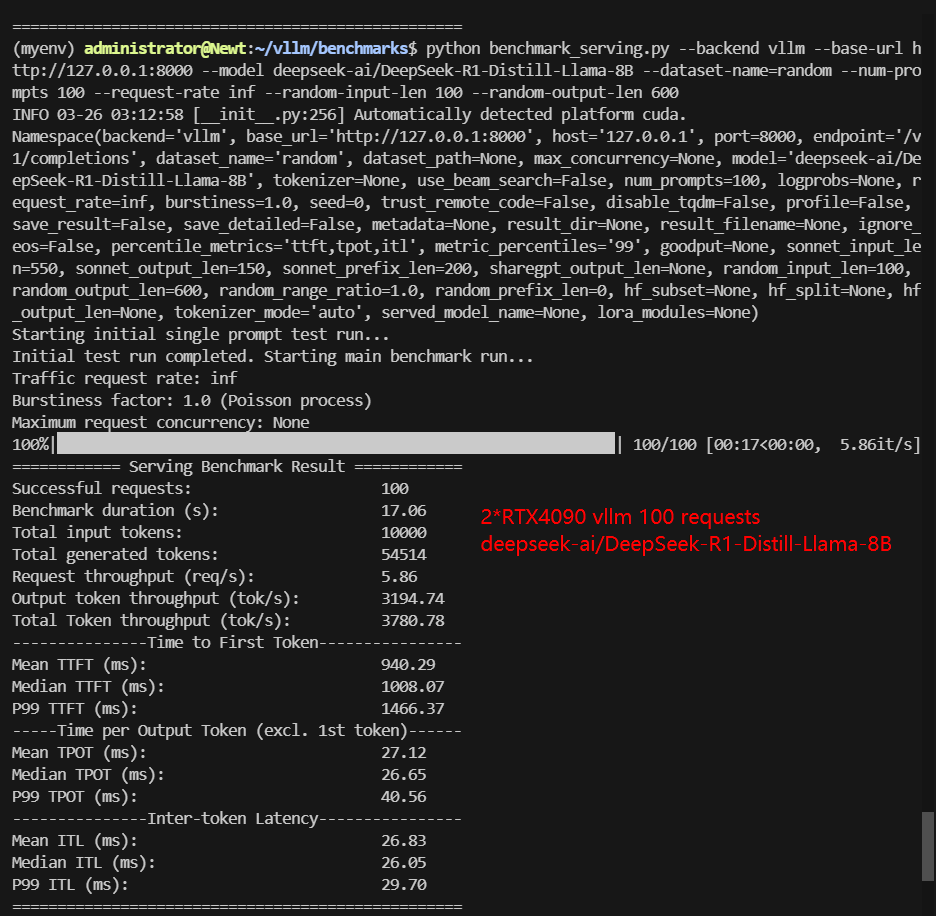
- deepseek-ai/DeepSeek-R1-Distill-Llama-8B
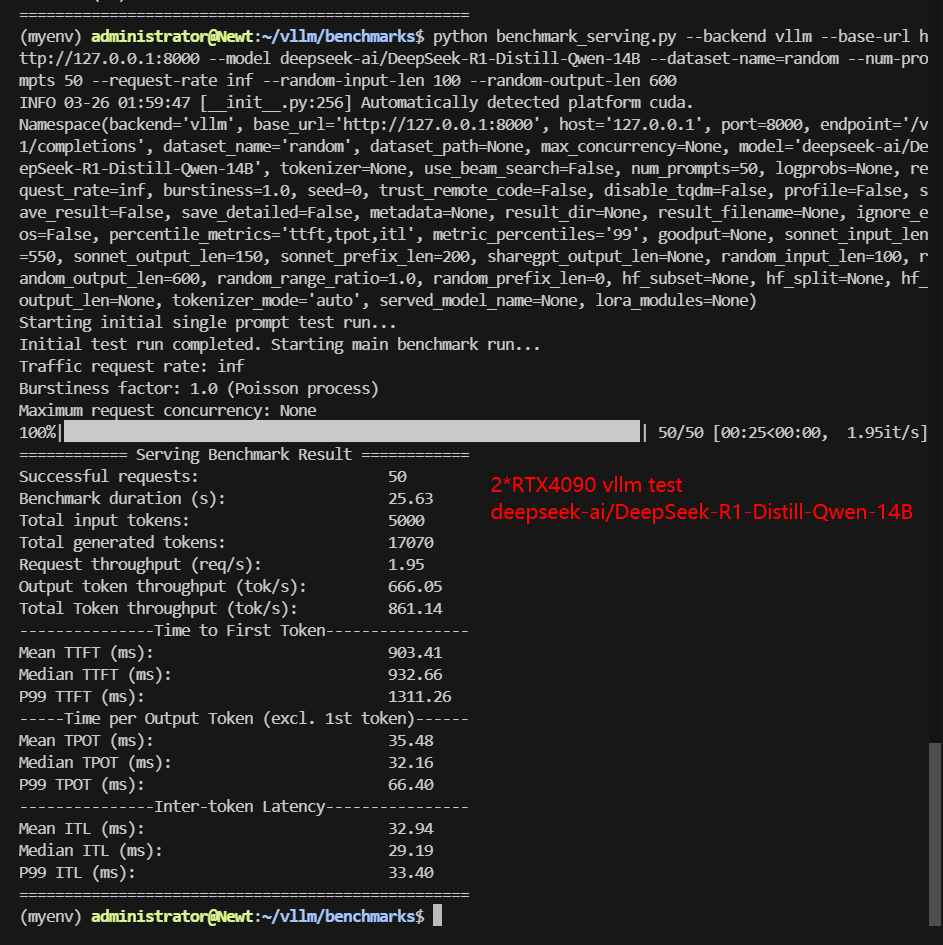
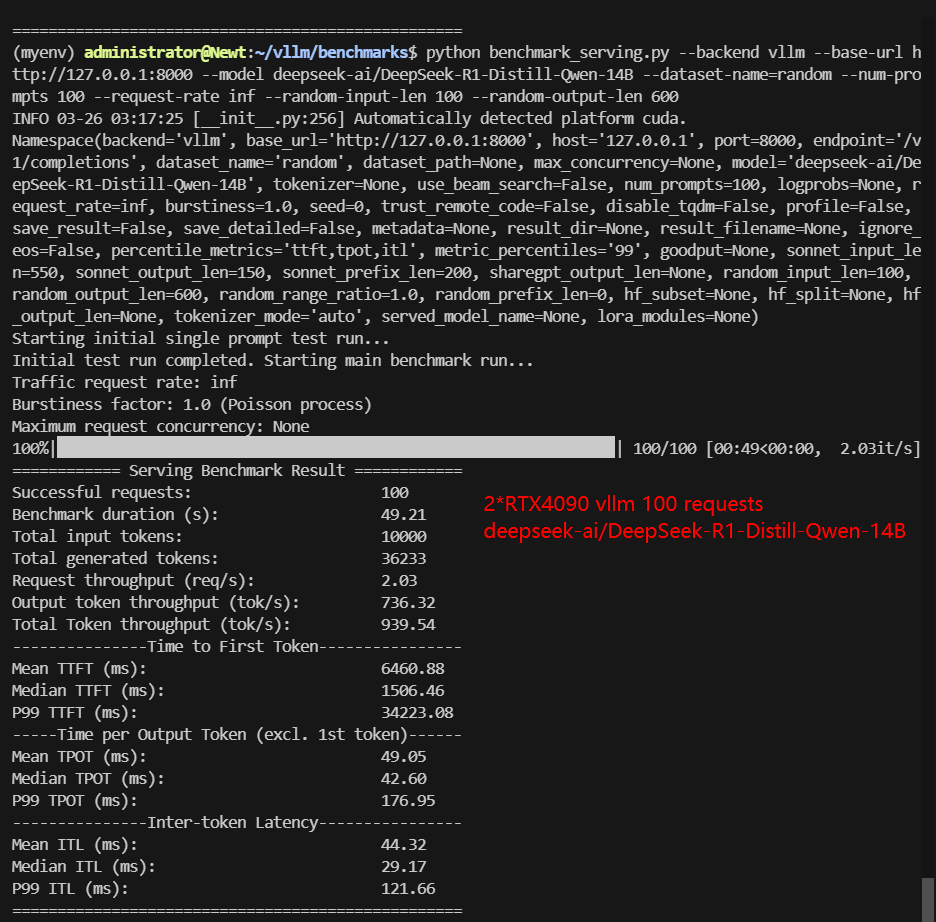
- deepseek-ai/DeepSeek-R1-Distill-Qwen-14B
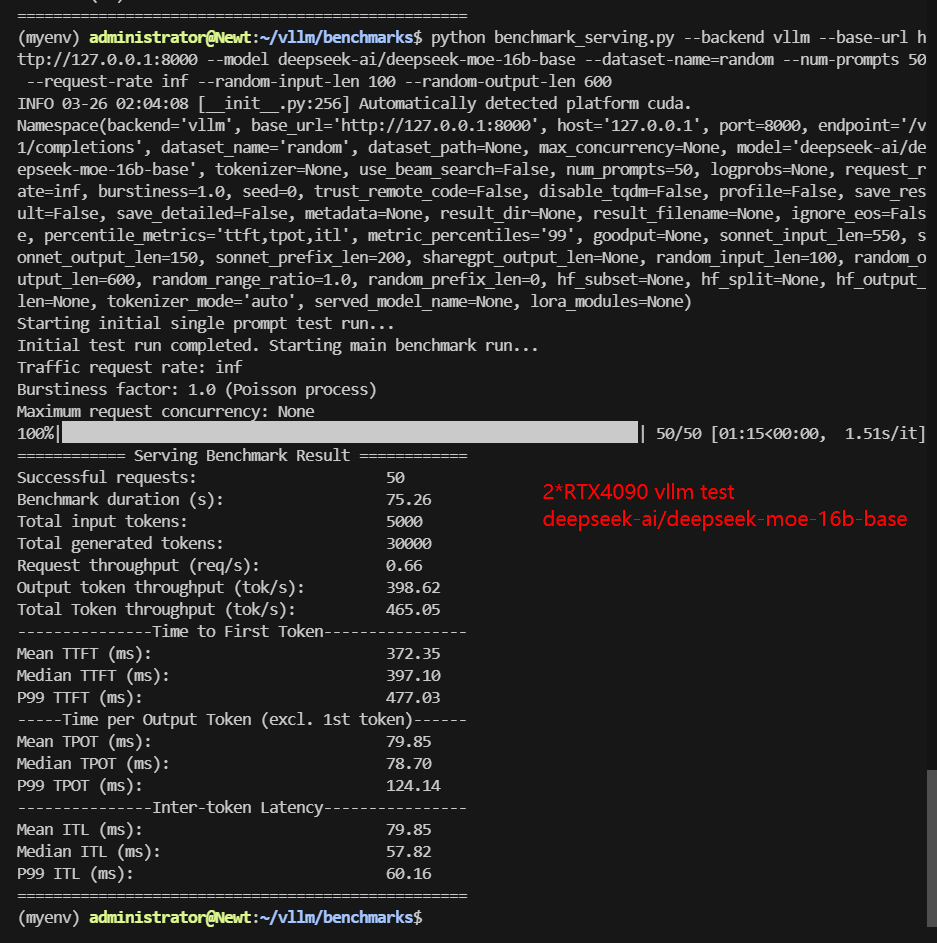
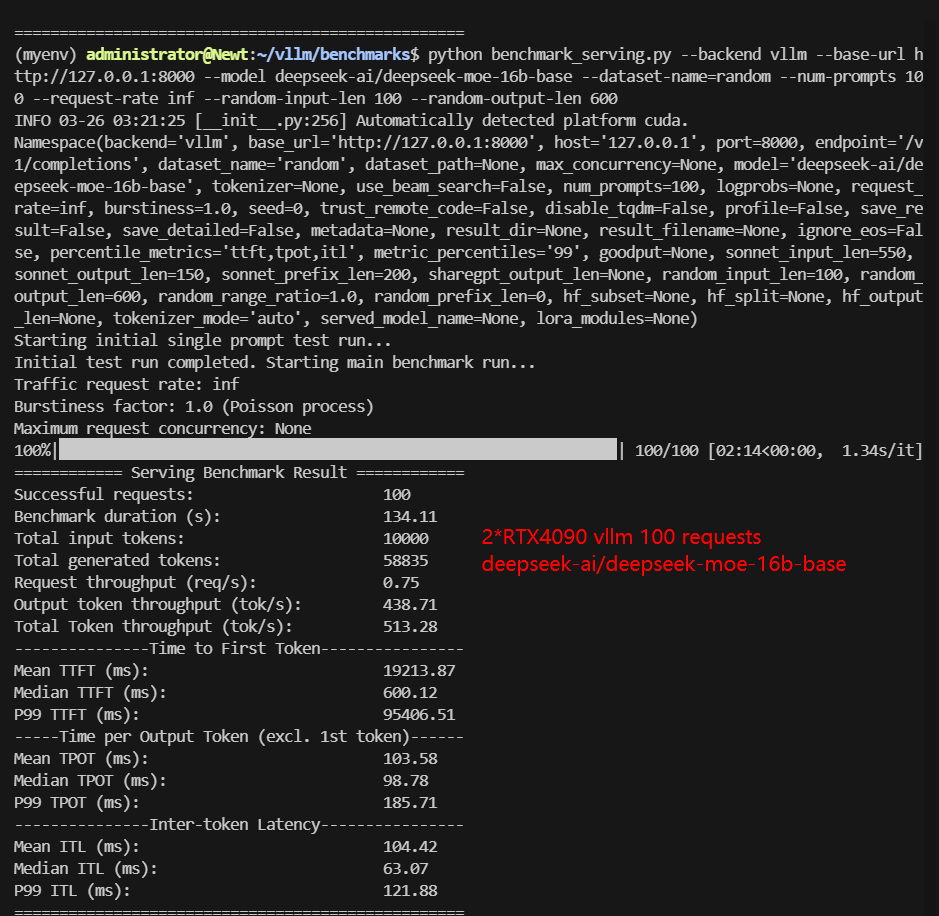
- deepseek-ai/deepseek-moe-16b-base
4. The Test Parameters are Preset as Follows:
- Input length: 100 tokens
- Output length: 600 tokens
- --tensor-parallel-size: 2
5. We conducted two rounds of 2*RTX4090 vLLM tests under different concurrent request loads:
- Scenario 1: 50 concurrent requests
- Scenario 2: 100 concurrent requests
2*RTX 4090 Benchmark for Scenario 1: 50 Concurrent Requests
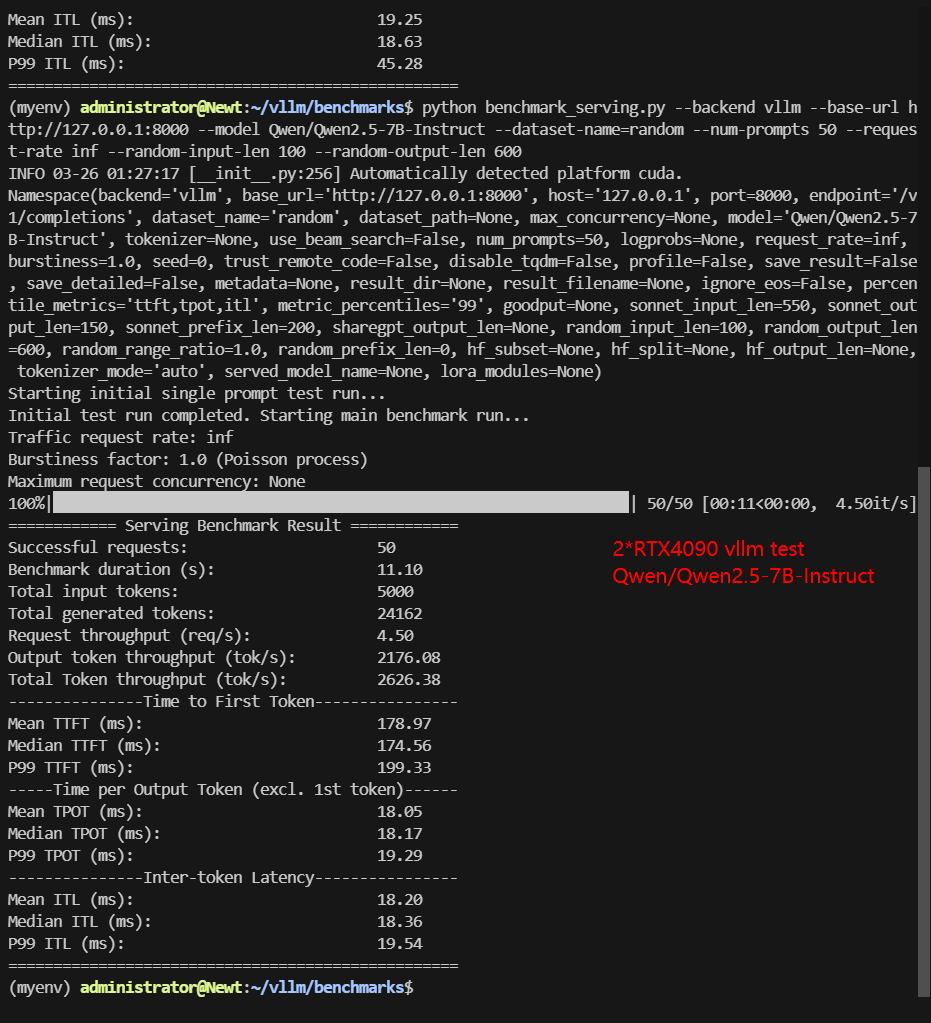
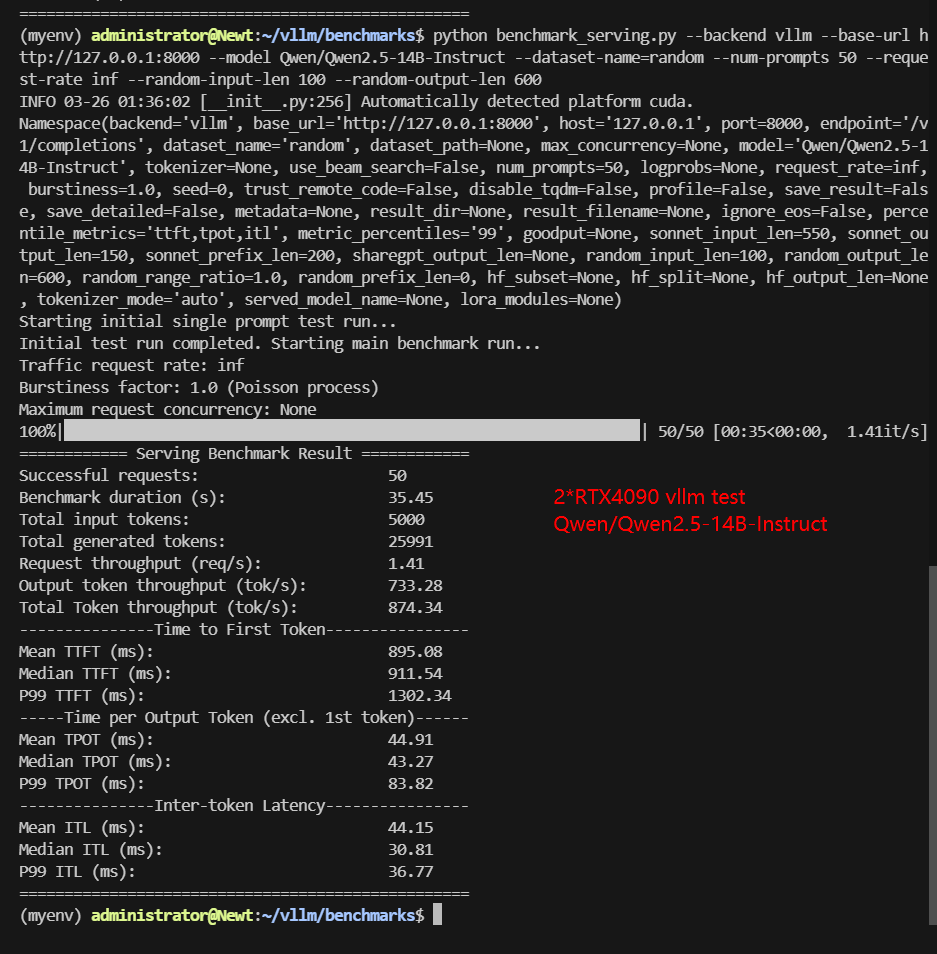
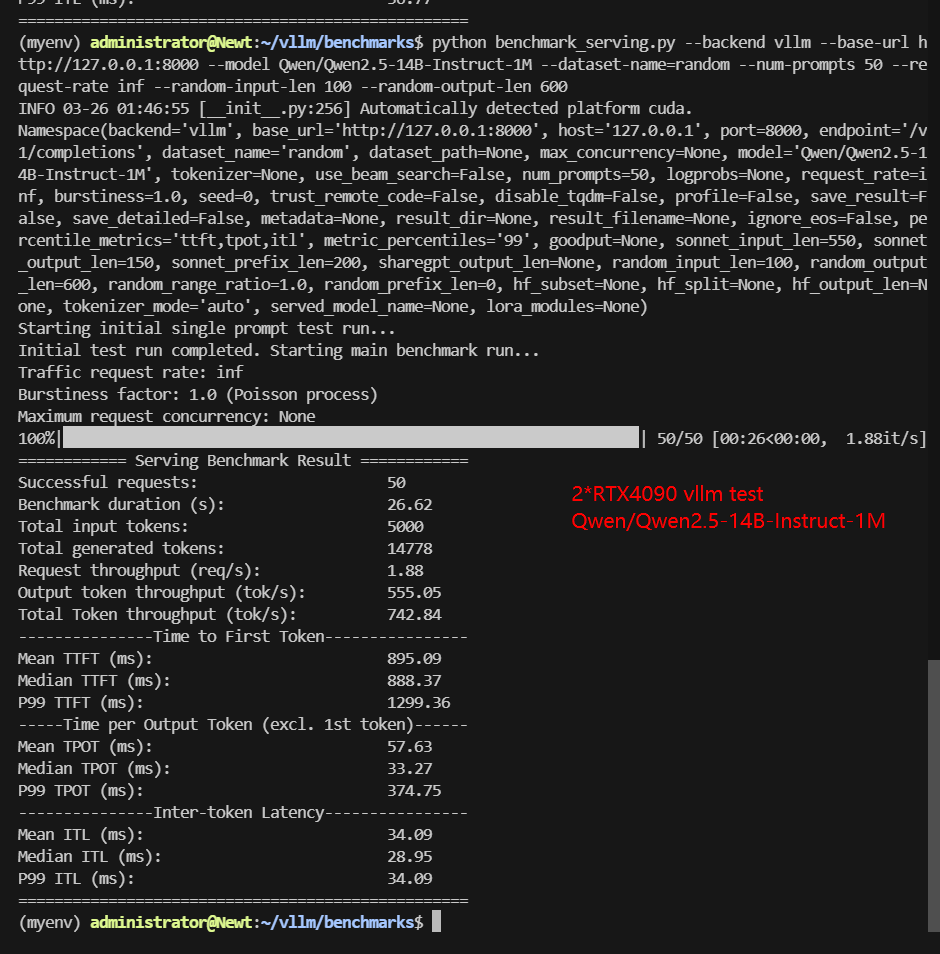
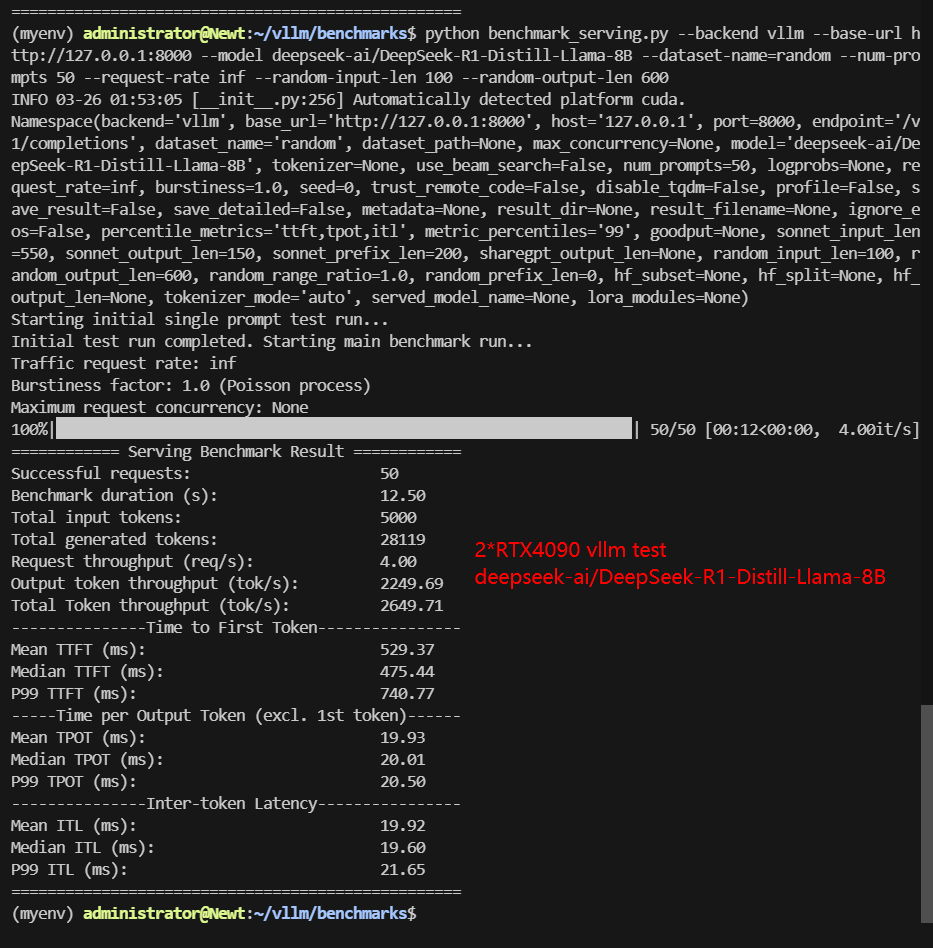
| Models | Qwen2.5-7B-Instruct | Qwen2.5-14B-Instruct | Qwen2.5-14B-Instruct-1M | DeepSeek-R1-Distill-Llama-8B | DeepSeek-R1-Distill-Qwen-14B | deepseek-moe-16b-base |
|---|---|---|---|---|---|---|
| Quantization | 16 | 16 | 16 | 16 | 16 | 16 |
| Size(GB) | 15 | 23 | 28 | 15 | 28 | 31 |
| Backend/Platform | vLLM | vLLM | vLLM | vLLM | vLLM | vLLM |
| Request Numbers | 50 | 50 | 50 | 50 | 50 | 50 |
| Benchmark Duration(s) | 11.1 | 35.45 | 26.62 | 12.50 | 25.63 | 75.26 |
| Total Input Tokens | 5000 | 5000 | 5000 | 5000 | 5000 | 5000 |
| Total Generated Tokens | 24162 | 25991 | 14778 | 28119 | 17070 | 30000 |
| Request (req/s) | 4.5 | 1.41 | 1.88 | 4.0 | 1.95 | 0.66 |
| Input (tokens/s) | 450.3 | 141.06 | 187.79 | 400.02 | 195.09 | 66.43 |
| Output (tokens/s) | 2176.08 | 733.28 | 555.05 | 2249.69 | 666.05 | 398.62 |
| Total Throughput (tokens/s) | 2626.38 | 874.34 | 742.84 | 2649.71 | 861.14 | 465.05 |
| Median TTFT (ms) | 174.56 | 911.54 | 888.37 | 475.44 | 932.66 | 397.10 |
| P99 TTFT (ms) | 199.33 | 1302.34 | 1299.36 | 740.77 | 1311.26 | 477.03 |
| Median TPOT (ms) | 18.17 | 43.27 | 33.27 | 20.01 | 32.16 | 78.70 |
| P99 TPOT (ms) | 19.29 | 83.82 | 374.75 | 20.50 | 66.40 | 124.14 |
| Median Eval Rate (tokens/s) | 55.04 | 23.11 | 30.08 | 49.98 | 31.09 | 12.71 |
| P99 Eval Rate (tokens/s) | 51.84 | 11.93 | 2.67 | 48.78 | 15.06 | 8.06 |
✅ Key Takeaways:
- 2*RTX 4090 performs well for 14B-16B models under moderate concurrency. DeepSeek-R1-Distill-Qwen-14B achieved 939.54 tokens/s. DeepSeek-moe-16B ran at 513.28 tokens/s.
- P99 TTFT remains below 2 seconds for most 14B models, making it suitable for real-time inference.
- Inference throughput is stable, proving 2*RTX 4090 can handle vLLM production workloads.
2*RTX 4090 Benchmark for Scenario 2: 100 Concurrent Requests
| Models | Qwen2.5-7B-Instruct | Qwen2.5-14B-Instruct | Qwen2.5-14B-Instruct-1M | DeepSeek-R1-Distill-Llama-8B | DeepSeek-R1-Distill-Qwen-14B | deepseek-moe-16b-base |
|---|---|---|---|---|---|---|
| Quantization | 16 | 16 | 16 | 16 | 16 | 16 |
| Size(GB) | 15 | 23 | 28 | 15 | 28 | 31 |
| Backend/Platform | vLLM | vLLM | vLLM | vLLM | vLLM | vLLM |
| Request Numbers | 100 | 100 | 100 | 100 | 100 | 100 |
| Benchmark Duration(s) | 16.69 | 71.06 | 51.41 | 17.06 | 49.21 | 134.11 |
| Total Input Tokens | 10000 | 10000 | 10000 | 10000 | 10000 | 10000 |
| Total Generated Tokens | 48681 | 50712 | 31722 | 54514 | 36233 | 58835 |
| Request (req/s) | 5.99 | 1.41 | 1.95 | 5.86 | 2.03 | 0.75 |
| Input (tokens/s) | 599.32 | 140.73 | 194.52 | 586.04 | 203.22 | 74.57 |
| Output (tokens/s) | 2917.58 | 713.66 | 617.03 | 3194.74 | 736.32 | 438.71 |
| Total Throughput (tokens/s) | 3516.90 | 854.39 | 811.55 | 3780.78 | 939.54 | 513.28 |
| Median TTFT(ms) | 823.92 | 1556.58 | 1443.16 | 1008.07 | 1506.46 | 600.12 |
| P99 TTFT(ms) | 1262.10 | 40030.84 | 36280.90 | 1466.37 | 34223.08 | 95406.51 |
| Median TPOT(ms) | 26.64 | 47.59 | 43.93 | 26.65 | 42.60 | 98.78 |
| P99 TPOT(ms) | 212.21 | 133.45 | 1964.77 | 40.56 | 176.95 | 185.71 |
| Median Eval Rate (tokens/s) | 37.54 | 21.01 | 22.76 | 37.52 | 23.47 | 10.12 |
| P99 Eval Rate (tokens/s) | 4.71 | 7.49 | 0.51 | 24.65 | 5.65 | 5.38 |
✅ Key Takeaways:
- 14B-16B models face significant performance degradation 100 concurrent requests.
- DeepSeek-moe-16B P99 TTFT exceeded 90s, making it impractical for high-load applications. DeepSeek-R1 Distill-Qwen-14B struggled with throughput under 100 requests. The P99 TPOT of Qwen2.5-14B-Instruct-1M increased to 1964.77ms.
- For models below 8B, performance remains strong. DeepSeek-R1 Distill-Llama-8B handled 100 requests with 3708.78 tokens/s throughput.
vLLM Performance Tuning Recommendations
✅ For 14B-16B models:
- Set tensor-parallel-size: 2 to properly utilize both GPUs.
- Limit concurrent requests to 50 for acceptable P99 TTFT.
- Use continuous batching to maximize throughput.
✅ For 7B-8B Models:
- Dual GPU parallel processing is much faster than a single GPU, but considering the cost, sometimes a single RTX 4090 may be sufficient, View the benchmark results of a single RTX4090...
- Can handle 100+ concurrent requests efficiently without major slowdowns.
Production Deployment Best Practices
✅ For Latency-Sensitive Applications:
- Prefer 7B-8B models for lower inference latency.
- When using the 14B-16B model, limit concurrency to 50 to maintain fast responsiveness.
✅ When Renting a vLLM Server:
- Ensure the provider supports multi-GPU configurations properly.
- Request benchmarks for your specific model size and workload before committing.
✅ Scaling for Future Demands:
- For larger models (16B+) or 100+ concurrency requests, consider upgrading to A100 or H100.
- Monitor P99 TTFT closely as a key SLA metric for production stability.
Get Started with 2*RTX 4090 Server Hosting
vLLM 2*RTX 4090 provides stable inference, making it a cost-effective alternative to enterprise GPUs.
Enterprise GPU Dedicated Server - RTX 4090
$ 409.00/mo
1mo3mo12mo24mo
Order Now- 256GB RAM
- Dual 18-Core E5-2697v4
- 240GB SSD + 2TB NVMe + 8TB SATA
- 100Mbps-1Gbps
- OS: Windows / Linux
- GPU: GeForce RTX 4090
- Microarchitecture: Ada Lovelace
- CUDA Cores: 16,384
- Tensor Cores: 512
- GPU Memory: 24 GB GDDR6X
- FP32 Performance: 82.6 TFLOPS
- Perfect for 3D rendering/modeling , CAD/ professional design, video editing, gaming, HPC, AI/deep learning.
Flash Sale to April 30
Multi-GPU Dedicated Server- 2xRTX 4090
$ 449.50/mo
50% OFF Recurring (Was $899.00)
1mo3mo12mo24mo
Order Now- 256GB RAM
- Dual 18-Core E5-2697v4
- 240GB SSD + 2TB NVMe + 8TB SATA
- 1Gbps
- OS: Windows / Linux
- GPU: 2 x GeForce RTX 4090
- Microarchitecture: Ada Lovelace
- CUDA Cores: 16,384
- Tensor Cores: 512
- GPU Memory: 24 GB GDDR6X
- FP32 Performance: 82.6 TFLOPS
Flash Sale to April 30
Enterprise GPU Dedicated Server - A100
$ 469.00/mo
41% OFF Recurring (Was $799.00)
1mo3mo12mo24mo
Order Now- 256GB RAM
- Dual 18-Core E5-2697v4
- 240GB SSD + 2TB NVMe + 8TB SATA
- 100Mbps-1Gbps
- OS: Windows / Linux
- GPU: Nvidia A100
- Microarchitecture: Ampere
- CUDA Cores: 6912
- Tensor Cores: 432
- GPU Memory: 40GB HBM2
- FP32 Performance: 19.5 TFLOPS
- Good alternativeto A800, H100, H800, L40. Support FP64 precision computation, large-scale inference/AI training/ML.etc
New Arrival
Enterprise GPU Dedicated Server - A100(80GB)
$ 1559.00/mo
1mo3mo12mo24mo
Order Now- 256GB RAM
- Dual 18-Core E5-2697v4
- 240GB SSD + 2TB NVMe + 8TB SATA
- 100Mbps-1Gbps
- OS: Windows / Linux
- GPU: Nvidia A100
- Microarchitecture: Ampere
- CUDA Cores: 6912
- Tensor Cores: 432
- GPU Memory: 80GB HBM2e
- FP32 Performance: 19.5 TFLOPS
Conclusion: When to Use 2*RTX 4090 for LLM Inference?
The dual RTX 4090 configuration proves to be a cost-effective solution for deploying 14B-16B(~30GB) LLMs in production environments, particularly when using vLLM with proper performance tuning. By limiting concurrent requests to 50 for larger models and utilizing tensor parallelism, developers can achieve stable performance with acceptable latency metrics.
For developers looking for vLLM server rental, multi-GPU inference, and cost-effective LLM hosting, 2*RTX 4090 provides strong performance without the high cost of enterprise GPUs.
However, for 32b LLMs and extreme concurrency (100+ requests), an enterprise-grade GPU like A100 or H100 is recommended.
Attachment: Video Recording of 2*RTX 4090 vLLM Benchmark
2*RTX 4090 vLLM Benchmark: 100 Concurrent Requests Test Hugging Face LLMs
Screenshot: 2*RTX 4090 vLLM benchmark with 50 Concurrent Requests
Screenshot: 2*RTX 4090 vLLM benchmark with 100 Concurrent Requests
Data Item Explanation in the Table:
- Quantization: The number of quantization bits. This test uses 16 bits, a full-blooded model.
- Size(GB): Model size in GB.
- Backend: The inference backend used. In this test, vLLM is used.
- Successful Requests: The number of requests processed.
- Benchmark duration(s): The total time to complete all requests.
- Total input tokens: The total number of input tokens across all requests.
- Total generated tokens: The total number of output tokens generated across all requests.
- Request (req/s): The number of requests processed per second.
- Input (tokens/s): The number of input tokens processed per second.
- Output (tokens/s): The number of output tokens generated per second.
- Total Throughput (tokens/s): The total number of tokens processed per second (input + output).
- Median TTFT(ms): The time from when the request is made to when the first token is received, in milliseconds. A lower TTFT means that the user is able to get a response faster.
- P99 TTFT (ms): The 99th percentile Time to First Token, representing the worst-case latency for 99% of requests—lower is better to ensure consistent performance.
- Median TPOT(ms): The time required to generate each output token, in milliseconds. A lower TPOT indicates that the system is able to generate a complete response faster.
- P99 TPOT (ms): The 99th percentile Time Per Output Token, showing the worst-case delay in token generation—lower is better to minimize response variability.
- Median Eval Rate(tokens/s): The number of tokens evaluated per second per user. A high evaluation rate indicates that the system is able to serve each user efficiently.
- P99 Eval Rate(tokens/s): The number of tokens evaluated per second by the 99th percentile user represents the worst user experience.
Tags:
tensor-parallel-size: 2, vllm performance tuning for multi-card parallelism, what gpu to use for 14-16b models, vllm benchmark, dual RTX4090 benchmark, 2RTX4090 benchmark results, dual RTX4090 test, vllm 2RTX4090, setting multi-card parallel reasoning llm, vllm server rental, 2*RTX4090 vs A100, vLLM production deployment, LLM inference optimization, cloud GPU rental